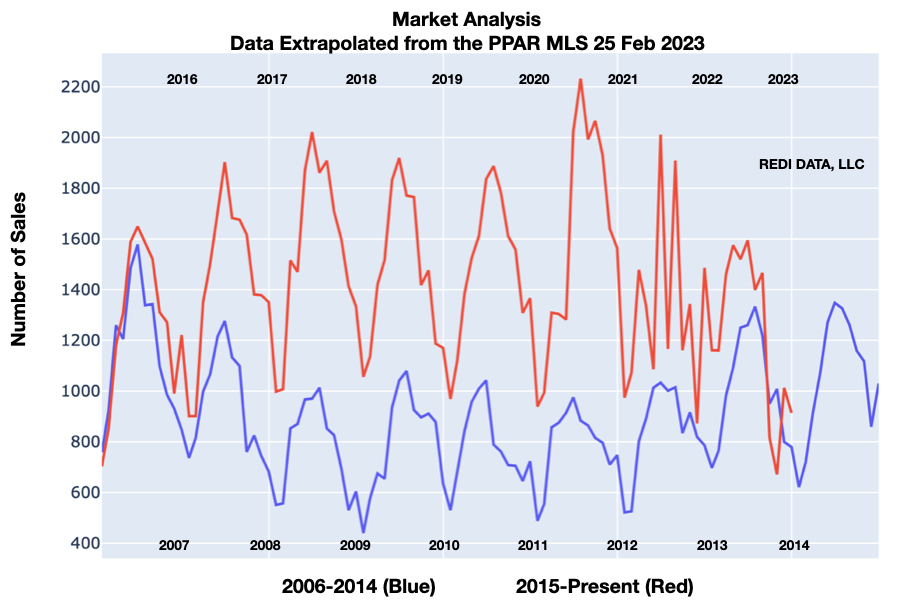
17 years of home sales
Take a look at this chart. It’s seventeen years of homes sales in the region. There are a lot of takeaways here, from the seasonality of the number of sales to the impact of Coronavirus and then the interest rate adjustments.
What else do you see?