What is the best month to sell a home in the COS region?
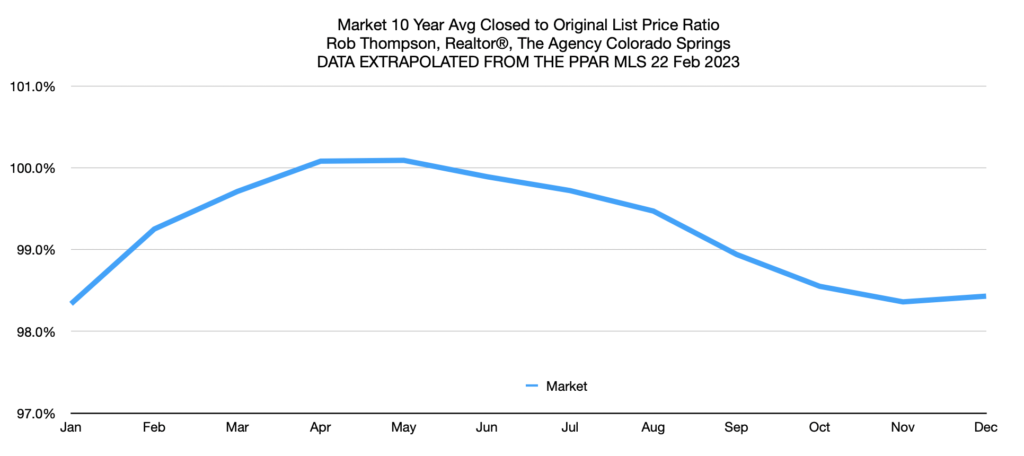
April and May according to the 10 year average closed to list price ratios.
What you see below is the average of ten years of closed to original list price ratios by month. As you can see, April and May are the highest of the months at 100.1%. November, December and January are the lowest months, coming in at 98.4, 98.4 and 98.3%, respectively.
However, it’s important to recognize location matters. Here we see 80910 mapped against the market average. As you can see, February underperforms the market but the rest of the year and October in particular outperforms the same (on the average).
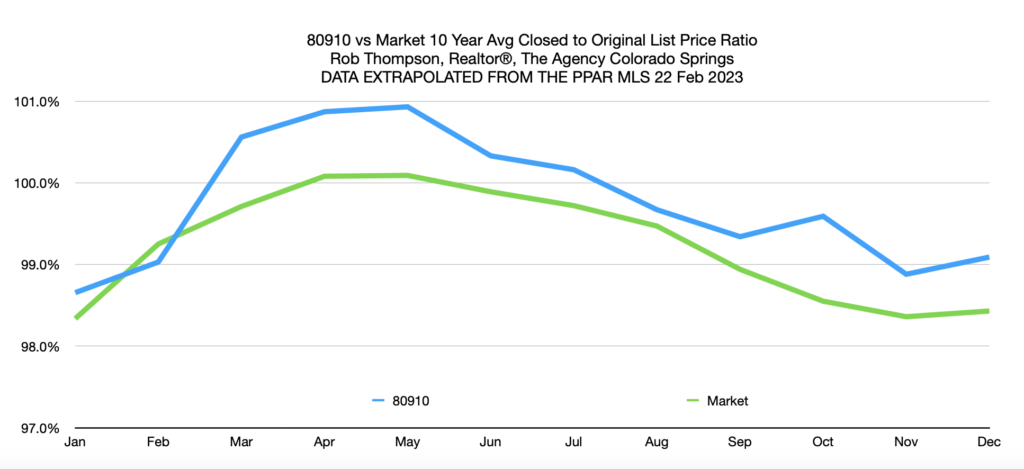
The bottom line here is make sure you are looking at your specific area, as granular as you can, but there are differences in what an area commands month to month.