April 2024 in the Colorado Springs region
As we roll into May, let’s take a look at April 2024. Below you see the history of April(s) since 1996. Here’s how to read this: April 2024 saw a 6% gain over the average sale price of April 2023, which itself saw a 6% decline over the preceding year.
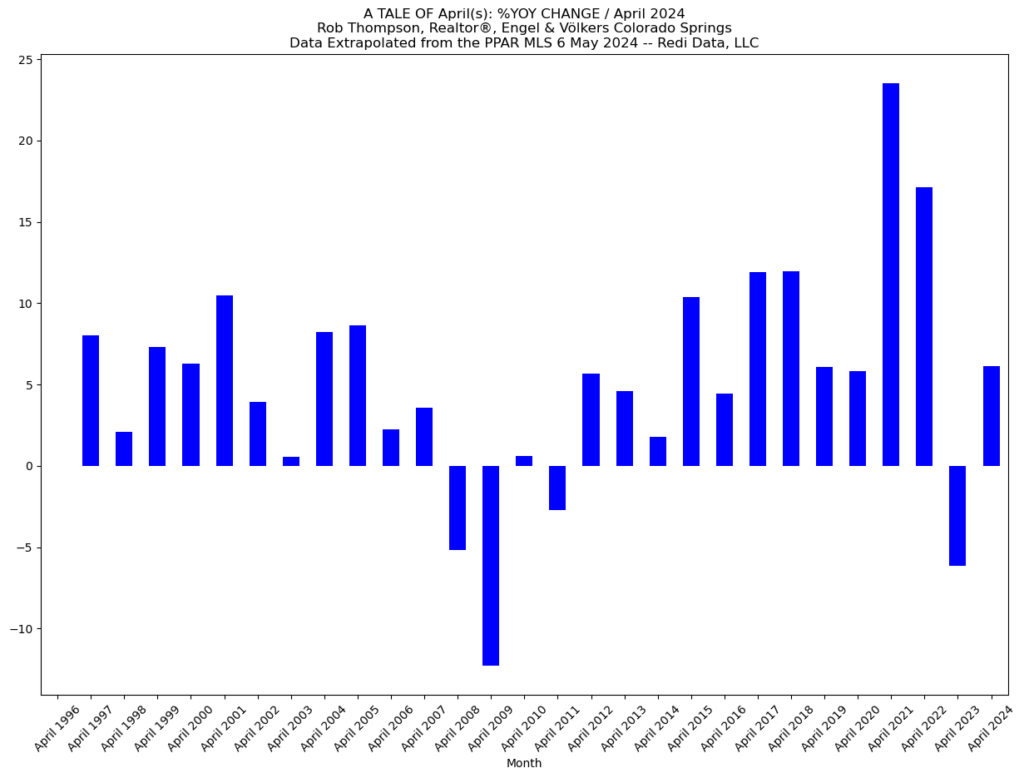
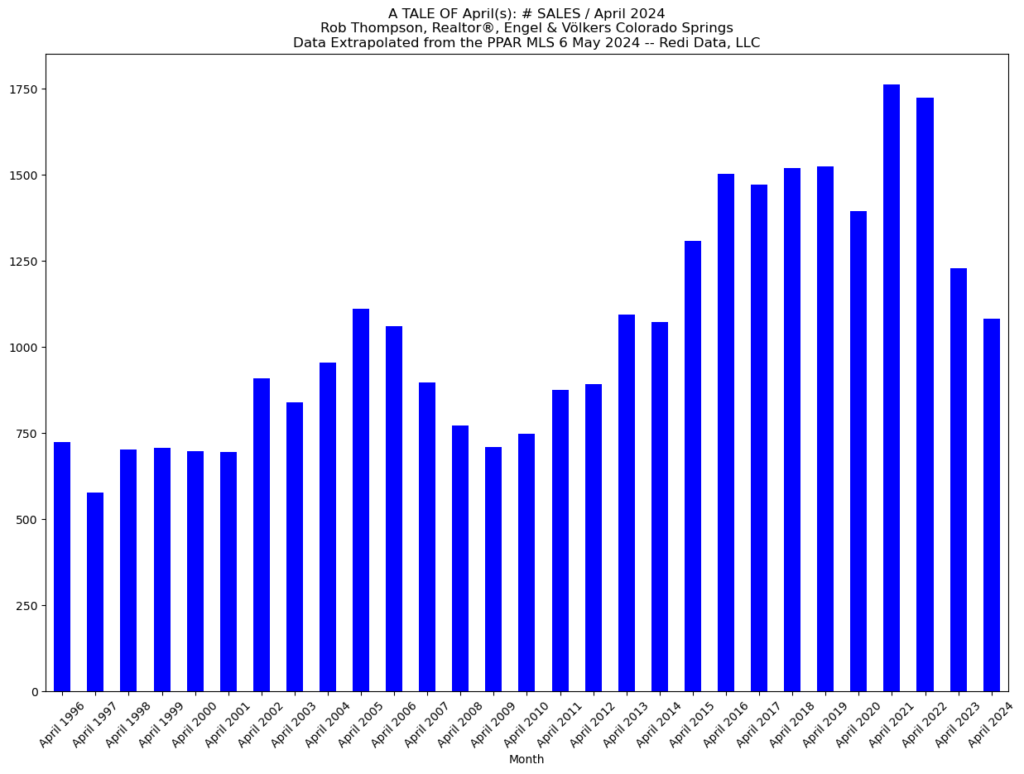
This happened despite the number of sales falling a bit (1081 vs 1228).
Here’s a look at the last five years. As you can see, the trend of volume of sales is down. A lot of homes are for sale relative to the number of sales happening.
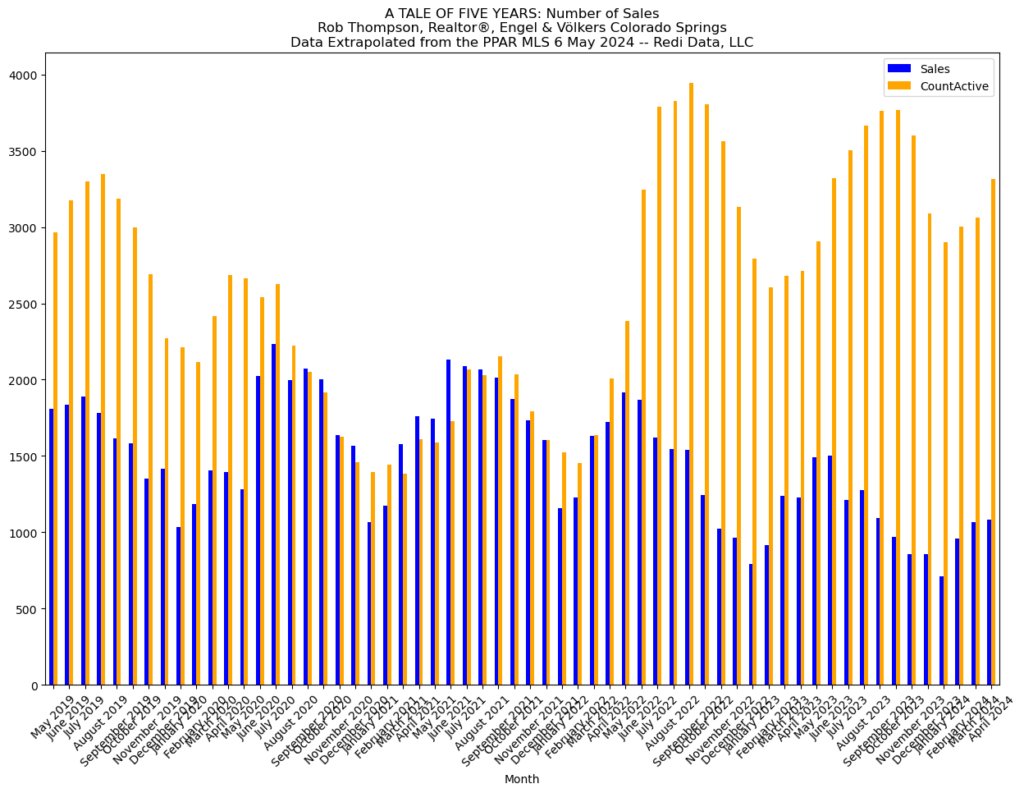
All things remaining equal, this trend is likely to continue.