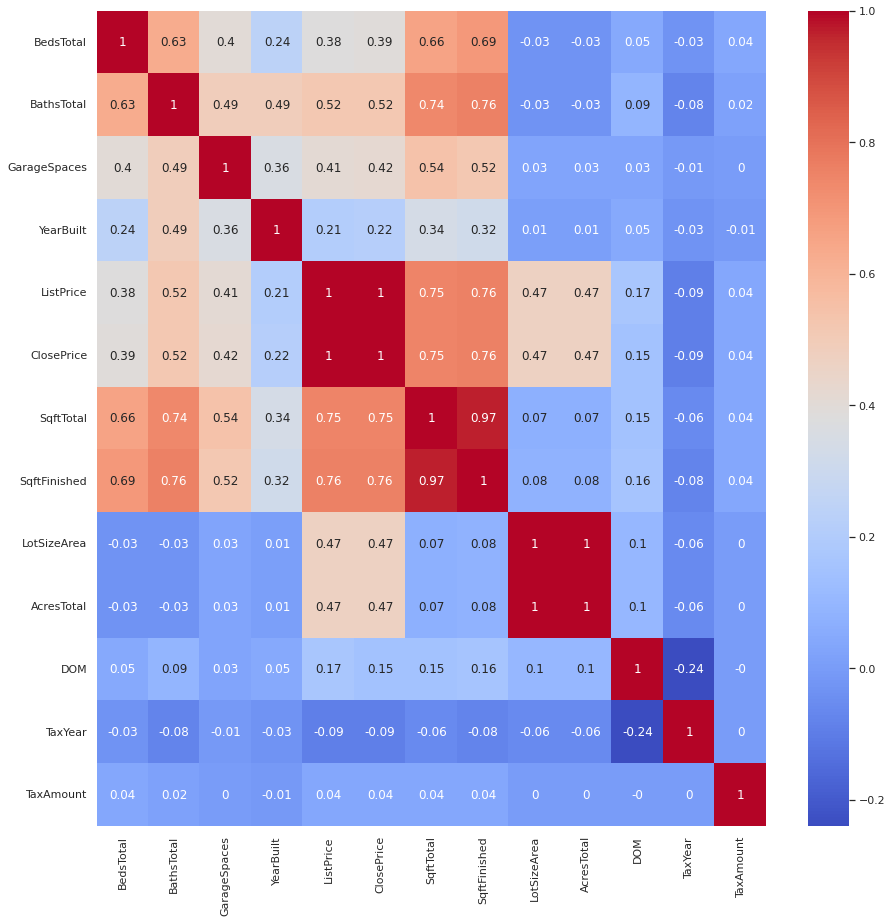
July – Aug 2022 Correlation Matrix
What you see here is a correlation matrix. This chart shows the correlation coefficient between variables. I.e., it shows the relationship between the listed variables in a house. E.g., in the last 30 days there is a .52 correlation between the closed price of a home and the total number of baths. This is a ‘weak’ correlation. Contrast this with .76 correlation between the total sq footage and the closed price of a home. This is a ‘strong’ correlation.
Take a look through these and let me know if there are any that surprise you!
Just found your blog, very cool stuff! Reading through it seems to me, at least from the data, that people in this period were interested in large common areas? How do you interpret it?
Thank you, Chris. That means a lot to me. That is also my interpretation from this data set. When I initially started this, I was surprised at the overall low levels of correlation. But it stands to reason, ultimately, that in a ´hot´ market, people would buy anything they can. As the market cools, I expect to see higher degrees of correlation among these variables.