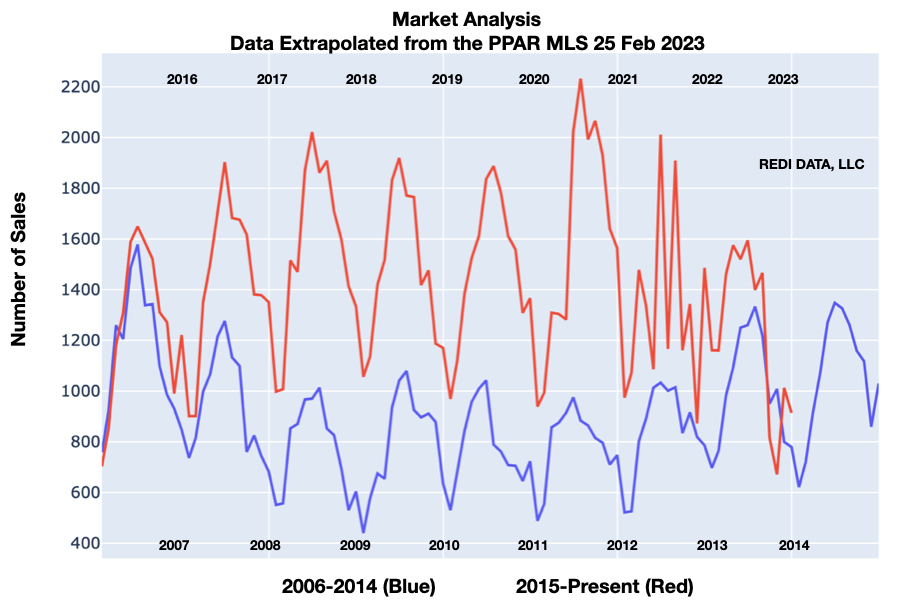
Take a look at this chart. It’s seventeen years of homes sales in the region. There are a lot of takeaways here, from the seasonality of the number of sales to the impact of Coronavirus and then the interest rate adjustments.
What else do you see?
Real Estate Meets Insight: Turning Data Into Decisions – Rob Thompson, Realtor®, Iconic Colorado Properties, LLC
Take a look at this chart. It’s seventeen years of homes sales in the region. There are a lot of takeaways here, from the seasonality of the number of sales to the impact of Coronavirus and then the interest rate adjustments.
What else do you see?