PPAR Region State of the Market
OnWe are closing for the month of March 2023 at an average of 501K with 46.86 days on the market. Homes are closing on.
Read MoreA Decade of DOM
OnThis morning’s graph is a representation of the average Days on Market (DOM) for closed homes by month over the last decade. As you.
Read MoreFed raises rates by 1/4 point…why does this matter?
OnWhy does this matter? When you take out a mortgage to buy a house, you are essentially borrowing a large sum of money from.
Read MoreMarch 2023 down 30.7% from March 2022
OnRunning the numbers today…as of 21 March 2023, sales are at 69.3% of last year’s volume of sales. Stated another way, the number of.
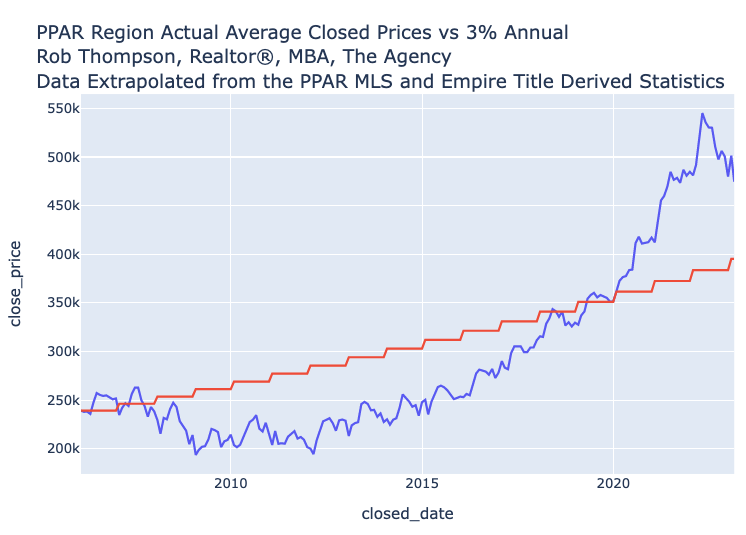
Read MoreHas housing in Colorado Springs beat the historical 3% return?
OnThree percent is often cited as the historical annual appreciation of housing. Let’s take a look at the last seventeen years and how the.
Read MoreWant to know where home pricing is going? Follow the M2.
OnWhat you see here is a scatterplot mapping the average monthly closed price of a home in the Colorado Springs region alongside the M2.
Read More4Q2022+ Types of Sales
OnHere is the distribution of types of sales from the 4th quarter of 2022 through this morning. These are pretty consistent with our market.
Read MoreFeb 2023 sales numbers close out down 29.6% YOY
OnFebruary 2023 closed down 29.6% from the previous year by number of sales. That is the second largest drop February to February as a.
Read More17 years of home sales
OnTake a look at this chart. It’s seventeen years of homes sales in the region. There are a lot of takeaways here, from the.
Read More