Want to know where home pricing is going? Follow the M2.
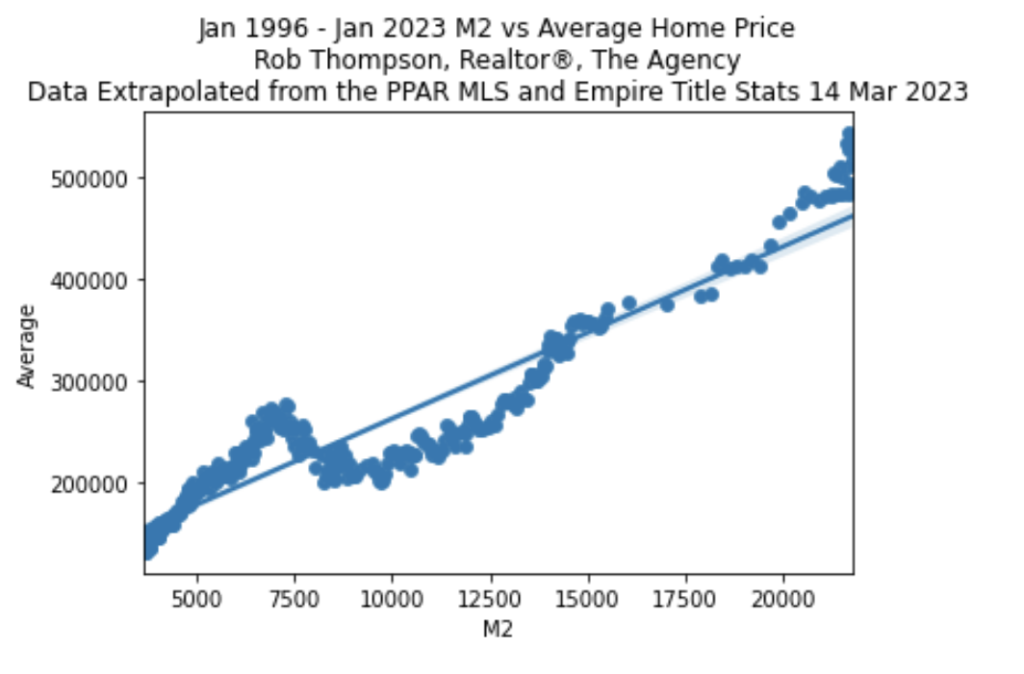
What you see here is a scatterplot mapping the average monthly closed price of a home in the Colorado Springs region alongside the M2 money supply.
What is the M2?
The M2 is a measure of how much money is available for people to spend and invest in an economy. It includes all the physical money like coins and paper money that we can use to buy things. But it also includes the money we keep in our bank accounts that we can use to buy things with a card or checks.
The reason M2 is important is that it helps us understand how much money people have to spend, which can impact things like prices and economic growth. For example, if there’s a lot of M2 money available, it means people have more money to spend, which can drive up prices and stimulate economic growth. On the other hand, if there’s not much M2 money available, it means people have less money to spend, which can cause prices to fall and slow down economic growth.
Economists and policymakers use M2 to track the overall money supply and to make decisions that can impact things like interest rates and inflation. By understanding the M2 money supply, they can make informed decisions that affect our economy and our daily lives.
Here is the M2 over the last 27 years.
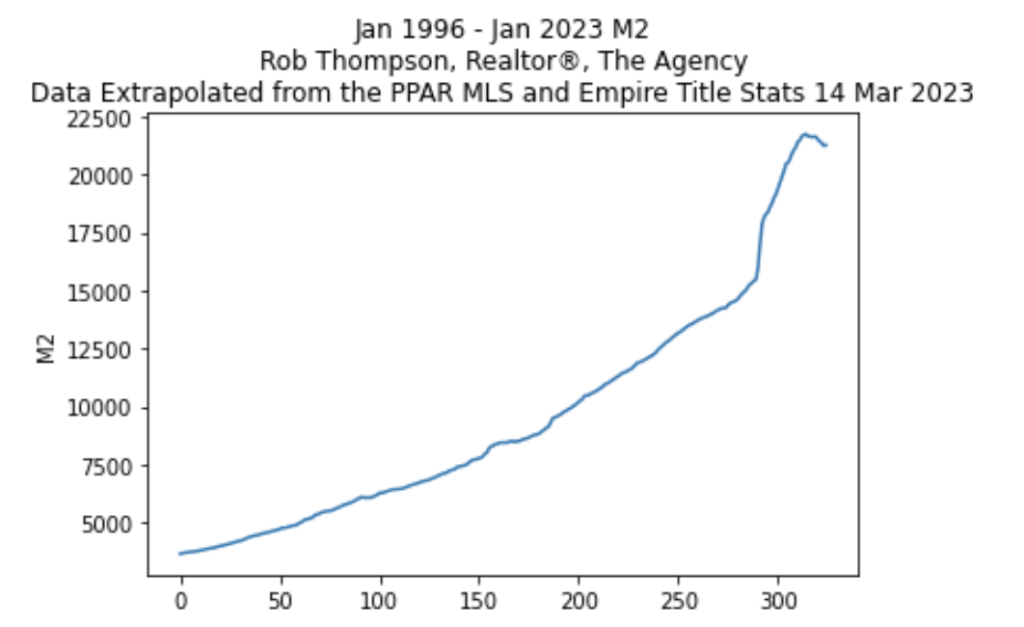
Can you see the spike at around the 150th data point? That would be 2008.
The M2 has increased significantly in recent years due to several factors, including:
- Quantitative easing: In response to the 2008 financial crisis and subsequent economic downturn, the Federal Reserve began a series of quantitative easing (QE) programs, in which it purchased large quantities of government bonds and other securities. This injection of funds into the economy increased the money supply.
- Government spending: The federal government has engaged in increased spending in recent years, particularly in response to the COVID-19 pandemic. This spending has led to a further expansion of the money supply.
- Low interest rates: The Federal Reserve has kept interest rates low in order to encourage borrowing and stimulate economic growth. This has made it easier for individuals and businesses to access credit, which has increased the money supply.
We haven’t really stopped since the financial crisis and you can see the near vertical expansion of Covid.
What does this all mean?
There is a 0.9837 correlation between the M2 money supply and the average price of a home in the region. The top end of the scale is 1. This means there is a very strong positive correlation between the two variables….or follow the M2 if you want to see where home prices are going.