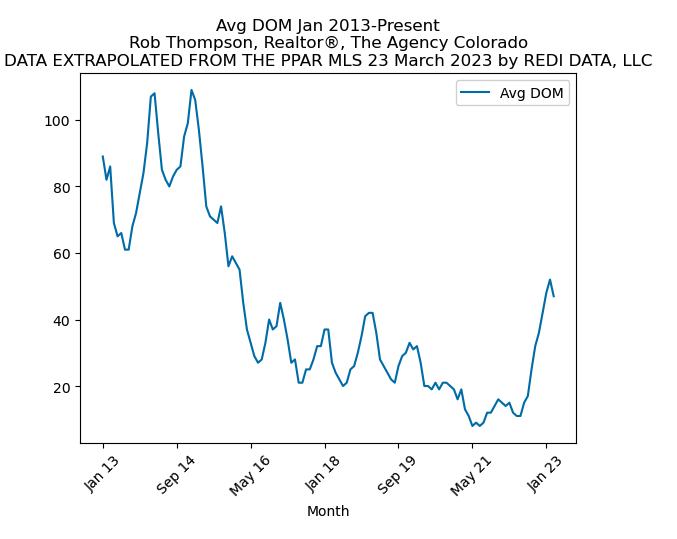
This morning’s graph is a representation of the average Days on Market (DOM) for closed homes by month over the last decade. As you can see below, we are back over over the last several months or so to around 2015 territory.
Inventory in the area remains low (less than two months) which is helping hold pricing relatively stable (we are down about 8% from the peak in May right now).
