Pikes Peak Region: June 2023
As we roll into July, let’s take a look at where June 2023 has closed out.
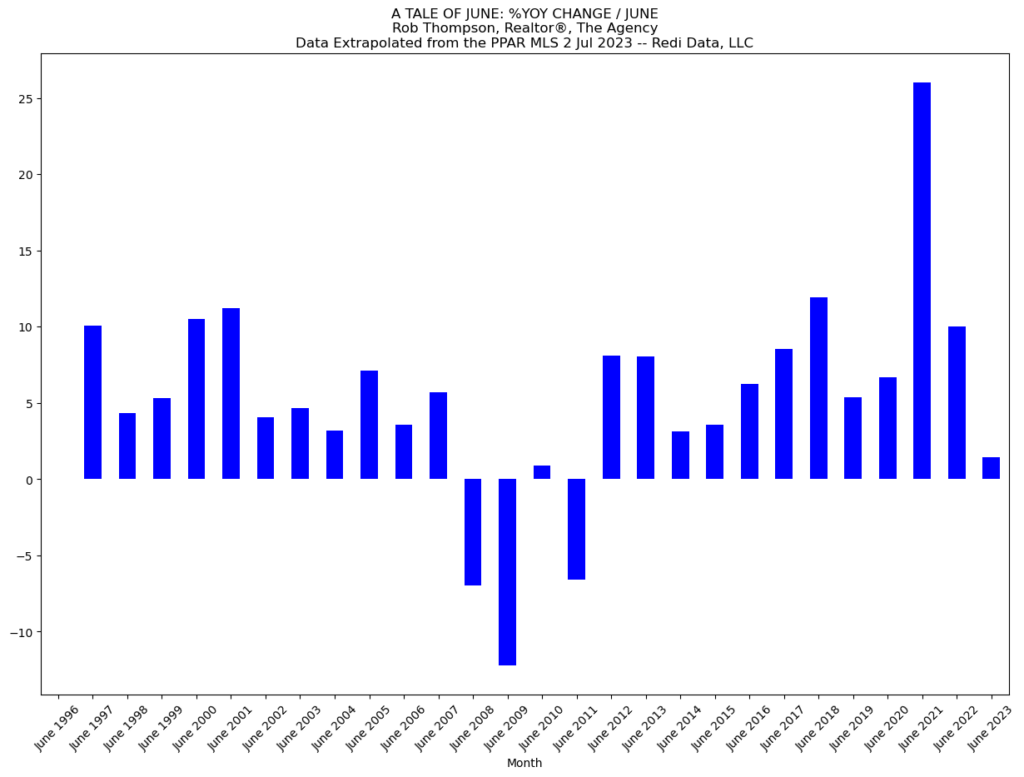
Here we see the year over year change in pricing from June to June since 1996. We can see last month was a gain in value of 1.43% over the preceding June (2022). Interestingly, this is the second lowest gain since 1996.
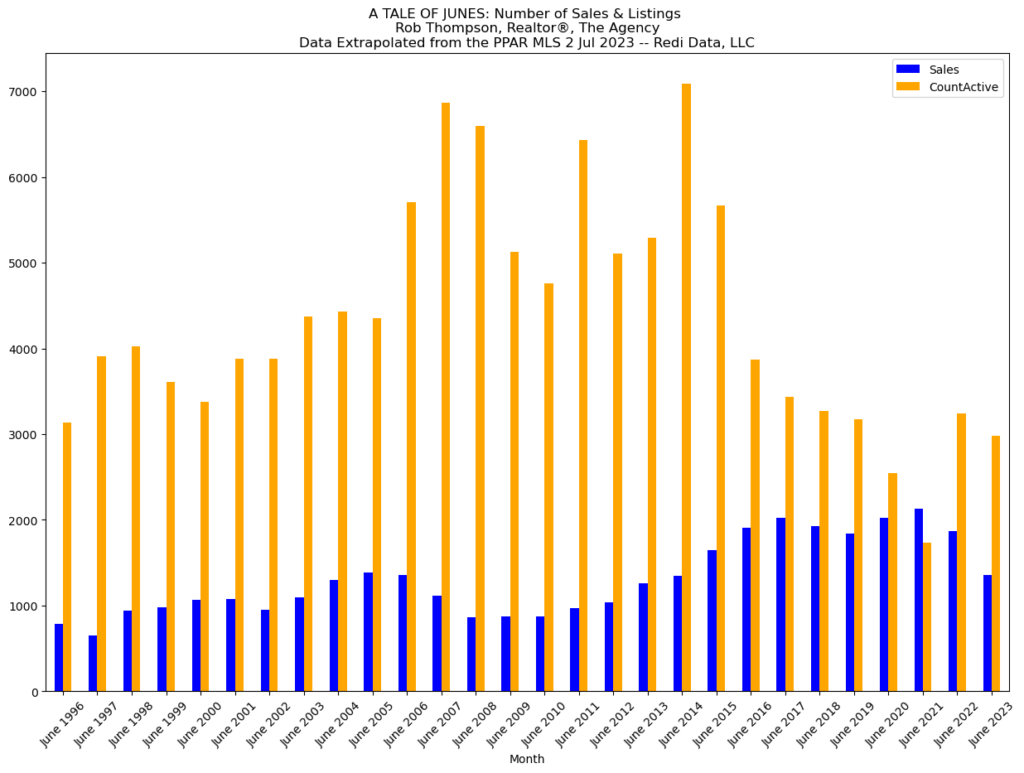
Here are the number of sales (blue) mapped along with the count of active listings.
Taken together, we can read these graphs as the following:
- Inventory for June is down from June 2022.
- Sales are down 27.3% from June 2022.
- The average price is up 1.43% from June 2022.
What does this mean for the market? I think it’s all consistent with where rates are right now. Rates are still high (relative to the 2-3-4% years), so affordability is down. Those who can afford to buy are doing so but there are fewer who can. Because rates are up and affordability is down, prices are high. But because inventory is low (1.8 months in the region), home prices are also holding.
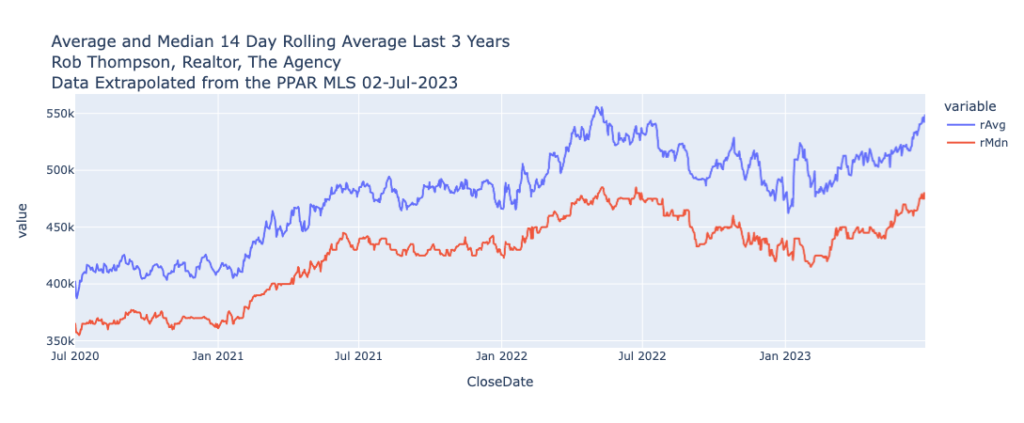
Let’s take a look at pricing before we close this post out. Here is the three year look at the 14 day rolling average and median pricing. On average pricing, we are back within 1.32% of the peak last May 2022.
Is this recovery?
No. It’s the intersection of low inventory and high (relative) mortgage rates. Keep an eye on the number of active listings…as this increases, we should see pricing start to fall back. But there’s a real chance in the next couple of months pricing passes last May.