A Tale of Decembers
As we roll into 2024, I wanted to get this graph out there.
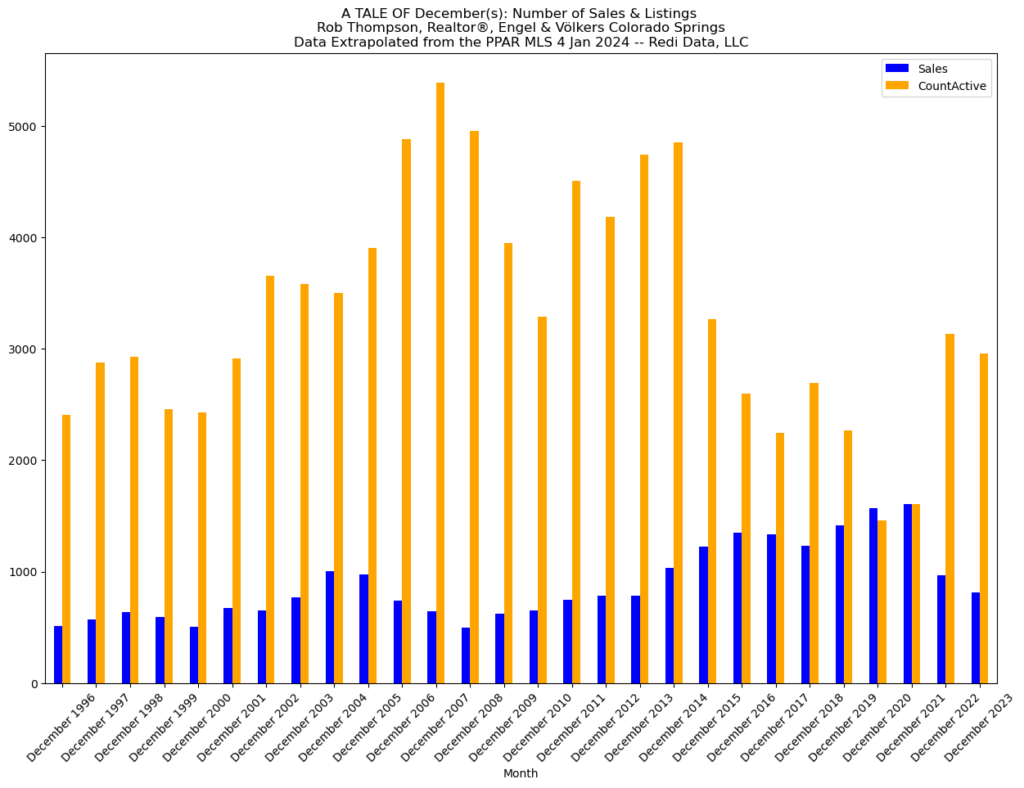
What you see here is 27 years of sales and active listings for Decembers for the Pikes Peak Region. I recently heard on a podcast that ‘inventory is an issue’ and that ‘demand exceeds supply’. On the macro perhaps, but I don’t think that’s true for Colorado Springs.
Let’s look at this through a couple of measures…
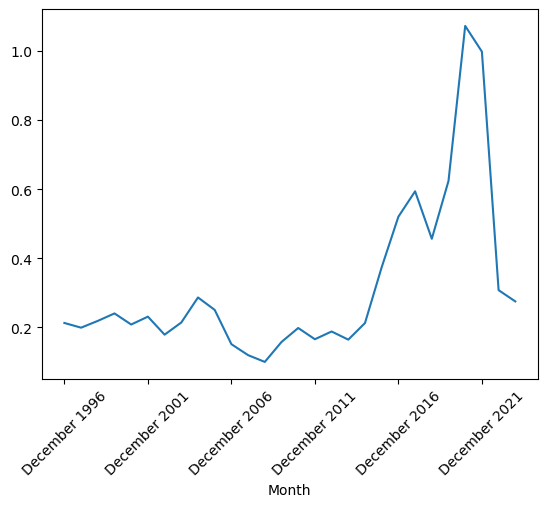
First, let’s look at the inventory levels. As of December 2023, we had just under 3,000 homes (2955) on the market. We had under 900 sales (813). The ratio here is actually .28. We sold 28% of the active listings for the month.
Here are the ratios for December over the last 27 years.
What, then, is the relationship between sales and active listings here? The R2 here, a statistical measure of the relationship, is .08. This means there is no statistical relevance between the number of active listings and the number of homes sold.
This measure is the sales-to-active listings ratio and helps us identify the type of market we are in. A high ratio would indicate a seller’s market. A low ratio indicates a buyer’s market. A mid ratio would indicate a balanced market.
Based on this trend line, it would look like we are in buyer’s market territory, following a couple of years of a seller’s market. That said, the R2 indicates this isn’t a measure we can apply with statistical relevance…e.g., we can’t assign a monetary value to the measure.