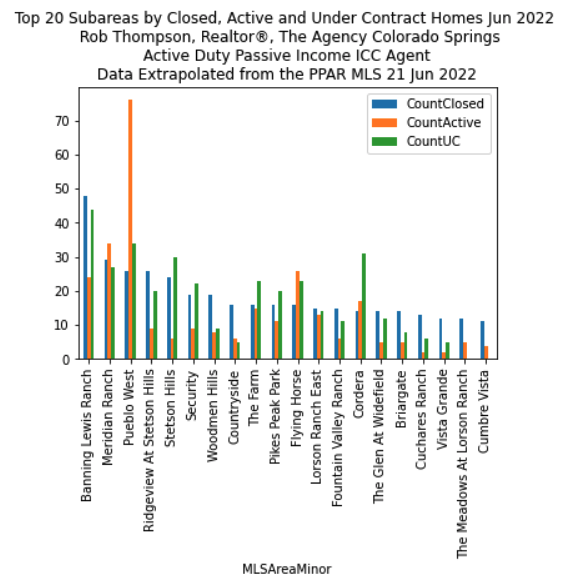
Top 20 Subareas by 30 day sales with active and under contract sales
Here is a quick snapshot of the top 20 subareas in the PPAR region, mapped in descending order by their number of sales in the last 30 days, followed by the count of active homes for sale and the number of homes under contract in the same.
Why does this matter? Good question!
It shows that inventory across the board is rising. Three of these subareas currently have more homes for sale than they have closings in the last thirty days, which will likely lead to increased price pressure (good for buyers).