Closed and Active Inventory 5 Jun 22 Colorado Springs
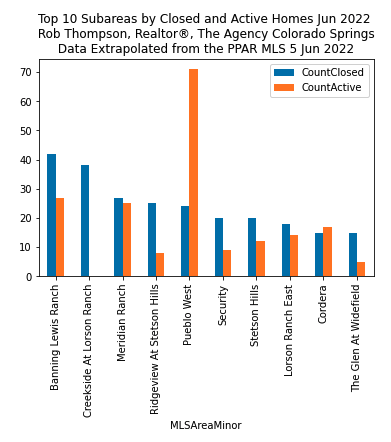
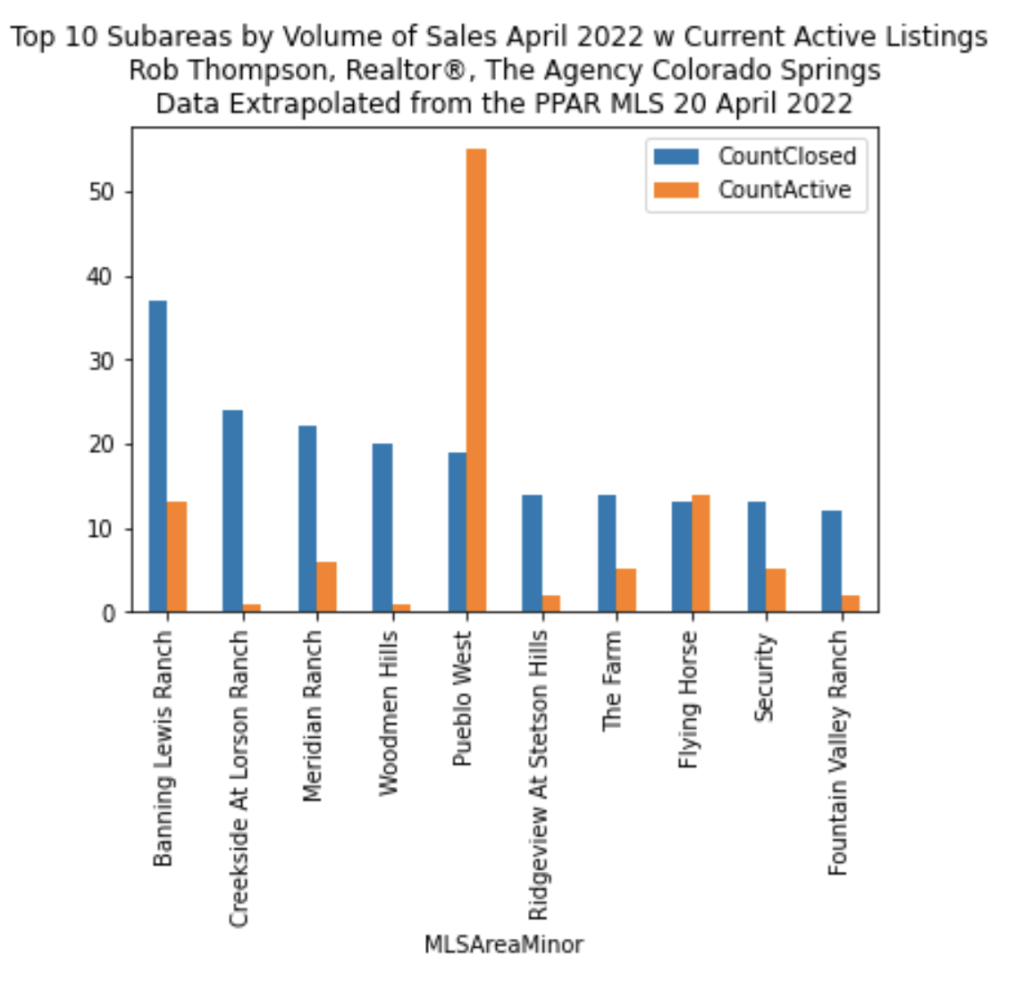
Here are the top 10 subareas by number of sales for the last 30 days. The blue bar represents the number of closed sales for the same, the orange the number of active listings. This is a pretty big shift from 6 weeks ago. This is a good thing for home buyers. Home sellers need to be ready to negotiate and for their homes to be on the market for longer.