Interest rates, M2 and Median Pricing in the PPAR region
The relationships between variables that impact the market is fascinating to me (I am, admittedly, a bit of a data nerd). What you see here is the interplay between the M2 money supply, median pricing and the 30 year mortgage interest rates since 1996.
TLDR; if you want to know where home prices are going, follow the M2.
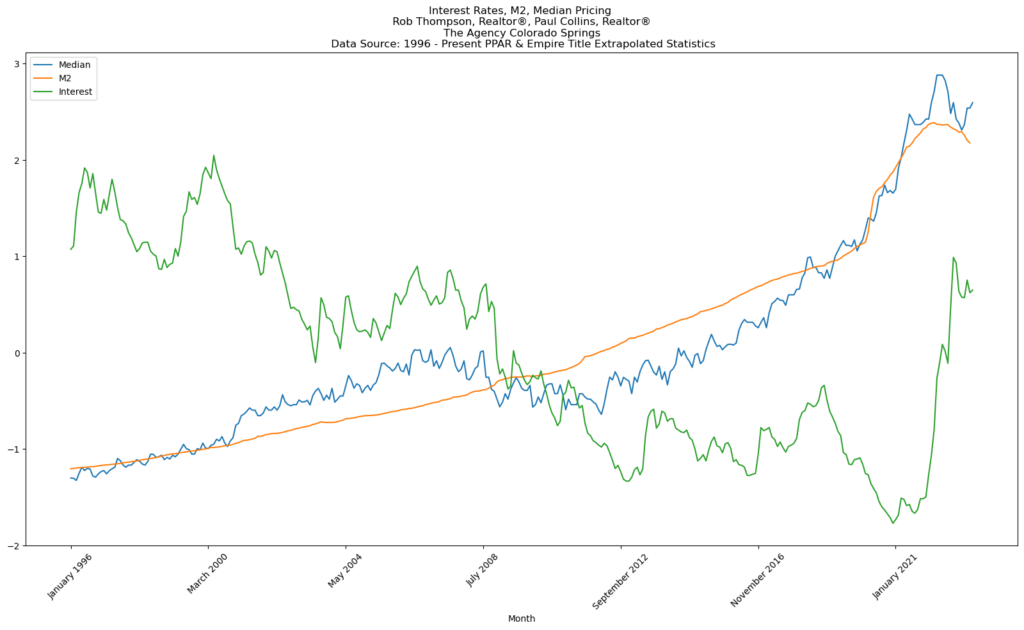
As you can see the median price of a home in the regions tracks the M2. The R2 is .92, which indicates a very high level of correlation. This suggests a strong positive linear relationship between these two variables. In this case, approximately 92% of the variability in the median pricing of homes can be explained by changes in the M2 money supply. This high R2 value indicates that the M2 money supply is a very good predictor of changes in the median pricing of homes. As the M2 money supply increases or decreases, there is a strong tendency for the median pricing of homes to move in the same direction.
While interest rates are often stated as the driver of sales, the R2 is -.70. The negative R2 value suggests that there is no linear relationship or predictive power between these two variables. In other words, the interest rates do not explain or account for any significant portion of the variability observed in the median pricing of homes. The negative sign indicates that the relationship between interest rates and median pricing, if any, is inverse or opposite.