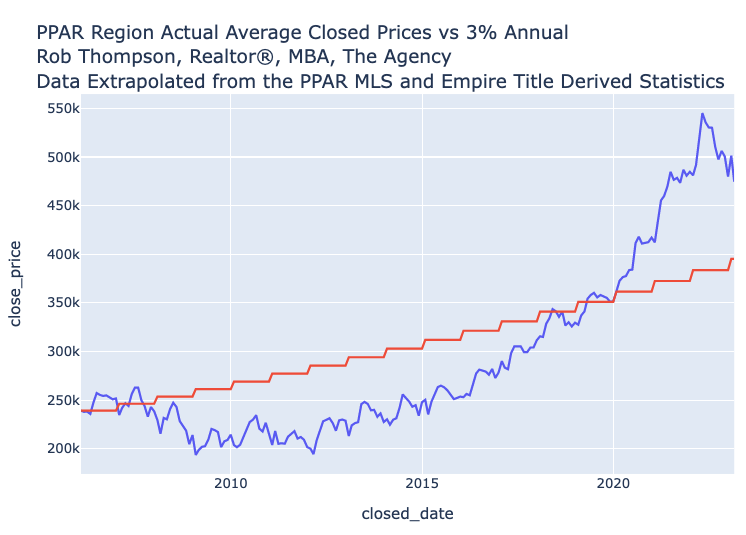
Three percent is often cited as the historical annual appreciation of housing. Let’s take a look at the last seventeen years and how the Springs as a region measures against that percentage.
What you see in the line chart below is that hypothetical / projected 3% since 2006 based on the average price of a closed home in January 2006 (red line) and stepped every January by 3%. The blue line is the actual closed monthly closed price of a home.
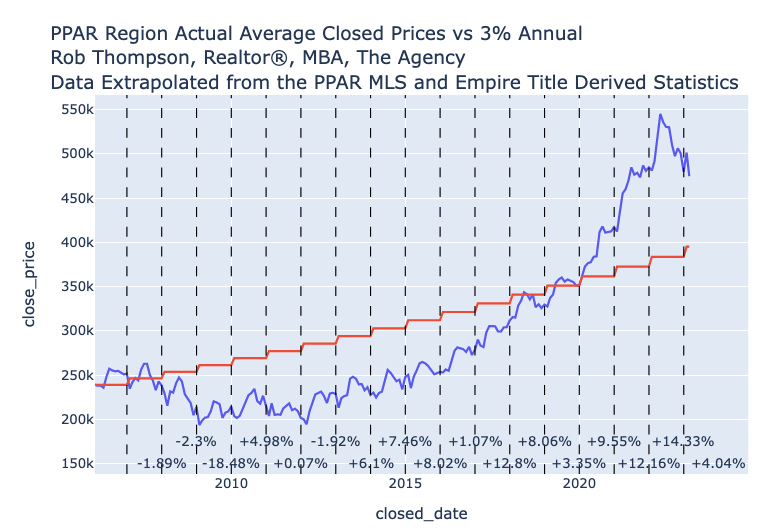
Each year since 2006 is represented by a vertical dashed line. Alongside the bottom of each line is the actual average rate of return on a home from the preceding year.
Here is that data in tabular format. Each year is the percent of change over the preceding year.
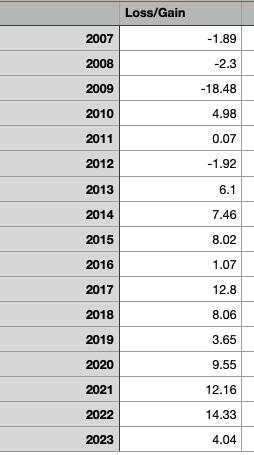
If you break these down, you will see 11 of these years had better than 3% returns. Four years had negative returns (for a total loss of -24.59%, which took five years to recover from). One was just under a 1% gain.
The total average return over the last seventeen years has been a gain of 3.98%. So, over this measured timeframe, we have surpassed the titled 3%. Of course, the individual loss or gain matters (a lot) when you bought (and if you sold).
The region has seen year over year gains since 2013. The price of a home has increased 57.5% since 2013 year over year as measured by January average pricing.
One thought on “Has housing in Colorado Springs beat the historical 3% return?”
Comments are closed.