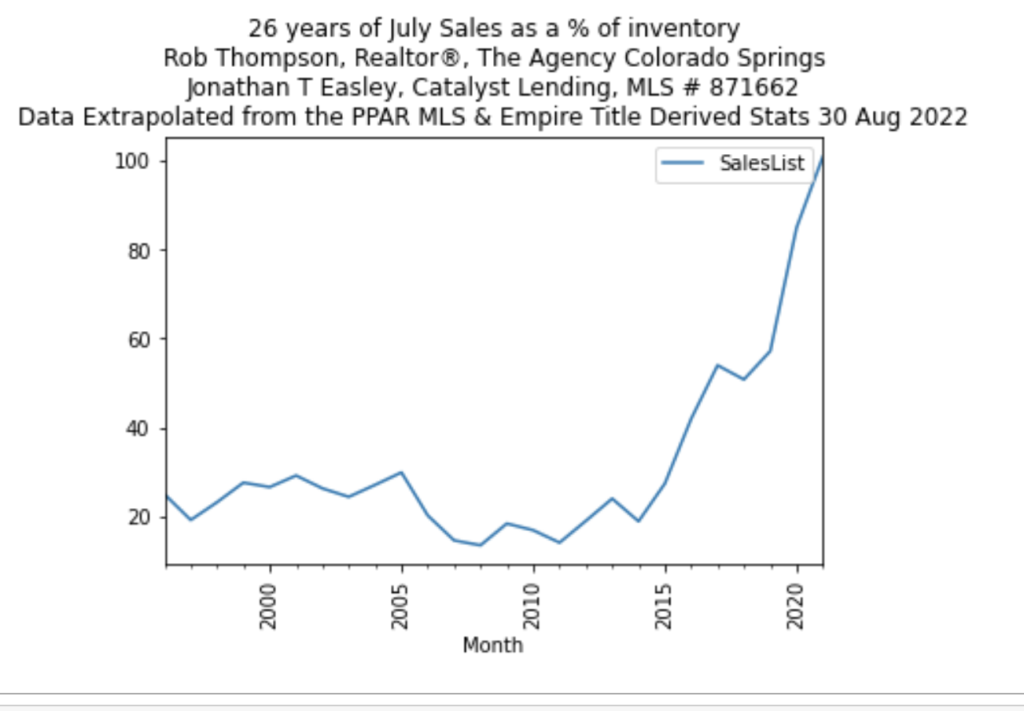
What you see here is a running percentage of July sales as part of inventory from 1996 to 2022. Jonathan Easley and I were talking numbers earlier today and he asked me to plot this statistic for him. How you read the graph is this: in July 2022, we sold 101% of the active listings. In July 2015, we sold 27.4% of the active listings.
Like this data based approach to real estate or have questions? Give me a ring at 719.440.6626 or Jonathan at 214-794-3399!